
Chapter 7
Getting Data Ready for Cleaning
By Oz du Soleil
One aspect of data that is difficult both to learn and to teach is how to get your data in shape so that it’s useful. There are a few common preparation tasks that you might encounter when working with data, especially if you’re handling data someone else collected. While we can use computers to perform many of the actions required for data preparation, there is a certain amount of manual involvement in figuring out exactly which tasks need to be done. For this reason, many people admittedly hate this part of working with data, but someone has to clean this stuff up!
Whether you’re a highly-paid data analyst with billions of records or a 1-person business with a 90-person contact list, you’ll be faced with messy data at some point. Unfortunately, data preparation isn’t a straightforward task and there’s no one right way to go about doing it. Each dataset is unique and some techniques may be used just once in a lifetime, as you’ll see in the examples below.
Separating Data
The first part of data preparation is separating data into the fields that will be most useful to you.
Have you ever been given a dataset where you couldn’t directly access the information you needed? Maybe complete addresses were in a single field, preventing you from getting statistics about specific cities and states. Perhaps a vendor sent an inventory spreadsheet with 6000 numbered parts but their numbering system includes the warehouse code followed by the part number and you need the part numbers by themselves.
| You Want | They Provide |
|---|---|
| C77000S | GA3C77000S |
| W30000P | GA1W30000P |
| D21250G | DE1D21250G |
Consider the challenges presented in the dataset below:
| Mall | Address | City | State |
|---|---|---|---|
| Warm Willows Mall Peters Road Marrison, MI | |||
| Jaspers Martinson & Timberlake Rds Reed, FL | |||
| Lara Lafayette Shoppes 17 Industrial Drive Elm, CT |
You want the mall name, address, city, and state to be stored in separate fields. The dataset has hundreds of malls in it so splitting the entries apart by hand would take a lot of time. The mall names are bold, which makes it easy to visually distinguish where the mall name stops and the address starts, but not all the addresses begin with numbers, so no standard tool exists for separating the data into different fields. Code can be written that will recognize the bold and plain font weights and peel them apart, but since this is a rare situation, it is likely that you won’t have it right at hand. This is a case where you might write code (or have someone write it for you) that you’ll never use for this purpose again.
We can’t teach you everything about how to split data in this chapter since every situation is unique. However, there are some strategies that are useful in many cases. We’ll go through a few of these, as well as some common challenges and their sources, to help get you started.
Let’s Begin
A straightforward example that many people encounter is separating first names from last names. You may receive a dataset where full names are contained in a single field and you need the first and last names to be separate, or there may already be separate fields for first and last names, but some of the entries have the full name in one of the fields.
All in one field:
|
Two fields, but not all info is in the correct place:
|
When datasets come to us this way, the challenge is seemingly easy to resolve. There are common ways of pulling apart the first names and last names for Keith, Fumi, and Warren. The easiest way is to look for the space, break the name apart at the space, and voila!
This is simple enough, but when we add in reality, things get complicated quickly. What if, for instance, your dataset has thousands of records? You’ll be spending a lot of time manually separating names, and there are far more potential name combinations than just first and last name.
| Middle Initials | Martina C. Daniels |
| Professional Designations | Lloyd Carson DVM |
| 2-part Last Names | Lora de Carlo |
| Prefixes | Rev Herman Phillips |
| Suffixes | Jimmy Walford III |
| Hyphenated Last Names | Tori Baker-Andersen |
| Last Name First | Kincaid Jr, Paul |
| 2-part First Names | Ray Anne Lipscomb |
| Prefixes/Suffixes | Rev Rhonda-Lee St. Andrews-Fernandez, DD, MSW |
| Other fields incorrectly included | Murray Wilkins 993 E Plymouth Blvd |
| No/Missing First Name | O’Connor |
| No/Missing Last Name | Tanya |
| No name at all | |
| I have no earthly idea! | JJ |
| Not a person’s name at all | North City Garden Supply |
Now what? Let’s Make Some Decisions
Let’s say we’re faced with separating the names so that you can sort by last name and that our list has 500 names (too large to consider reformatting by hand).
Before starting, we need to know certain things:
- Why is it important to parse this specific field? Is anything being hurt by having names all in one field?
- What do we want the result to look like?
- Is it important to keep ‘Rev.’ and create a separate field to hold other titles like Dr., Mrs., Capt., etc.?
- Should ‘Jr’ stay with the last name or should there be a separate field for it?
- Should middle initials be kept? In their own field? With the first name? With the last name?
- Do we want to keep professional designations?
- Is it worth the cost of getting it done? In simple cases, you may be able to hire someone else to complete the work, but this might not be ideal for complicated ones. What if a professional said they could fix the list for $1000?
- What do we do with incomplete or incorrect entries?
These questions should be answered before you start working with your data. If you just dive in, you can create a larger mess, and these decisions can actually make the process much easier. For example, if you decide that the professional designations don’t matter, there might be an easy way to get rid of them and simplify other parts of the project.
Say you’re working with a list of 20,000 names, 19,400 from the US and 600 from Turkey. The honorific titles in the US come before the name (e.g. Mr. John Smith), whereas Turkish honorific titles come after the name (e.g. Jon Smith Bey). You’re trying to figure out if you need separate fields for the Turkish data or another dataset altogether, so you ask the client what their preference is.
Their answer is simple. They aren’t conducting business in Turkey and they don’t care if you delete those records. GREAT! Just 19,400 records left.
Now, how do we break up these data?
There are so many techniques, we could write an entire book on this subject alone. You can break apart the data in Excel, or if you have programming skills, you can use Python, SQL, or any number of other languages. There’s too much for us to cover in this chapter, but for some good references, check out our Resources Appendix. For right now, we’ll cover some basic starting strategies so you’ll be better equipped to take on those references when you’re ready.
You should always make a copy of your dataset before doing any data preparation or cleaning in case a change you make is incorrect and you need to refer to the original.
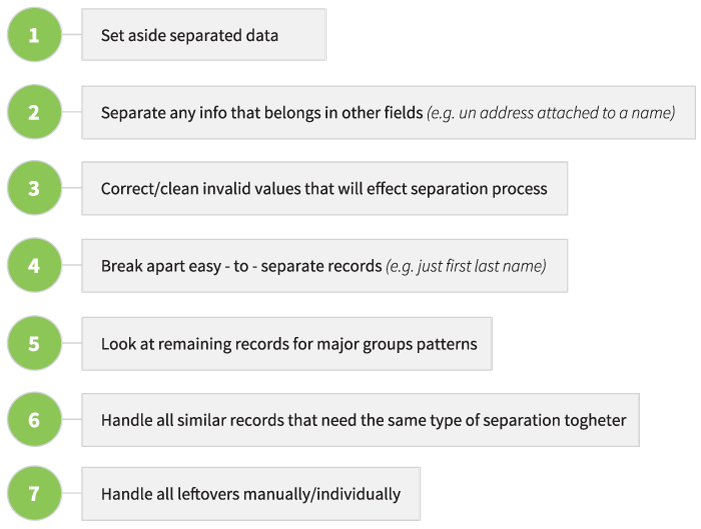
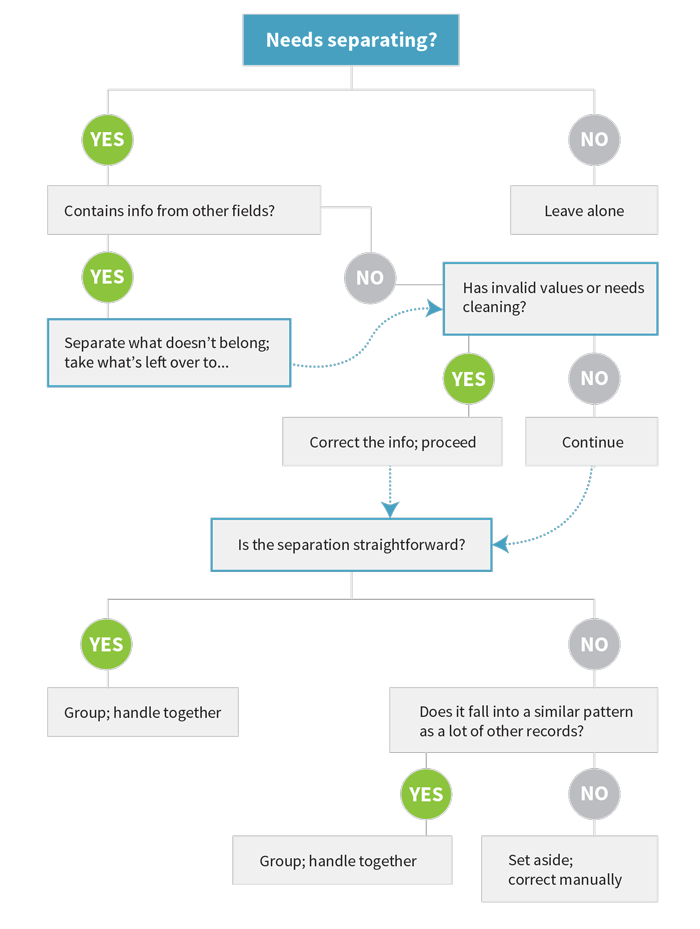
Look for Low-Hanging Fruit
In many instances, most of the data that need to be separated are fairly simple. Out of 500 names, you may discover that 200 have just a first and last name. Set these aside. Leave them alone. Then look at the remaining 300 names.
Identify the Oddities
Look through your dataset for the no-names, complicated names, incomplete names, non-person names and any entries you don’t know what to do with. Set these aside. We’ll say these comprise 40 more names.
Look for Similarities
Of the 260 remaining names, maybe 60 are complicated by professional alphabet soup after their names. Whether you’re deleting these professional designations or putting the designations in their own field separate from the name, work with them all at once. Now the designations are separate (or deleted) and you have a field with just names. For those that have only a first and last name, add those to the 300 that were set aside at the beginning.
We put the 2-part last names and other remaining types into their own groups.
Manual Effort
The 40 oddities you identified at the start may come down to just re-typing manually, depending what is odd about them.
Sometimes, when we’re handling data in real life, records take care of themselves. For example, maybe a non-name record turns out to be a duplicate of a record that’s complete. In that case, we can just delete the incorrect record and move on.
Commonly Problematic Fields
Depending on how data are collected, there are other fields you may be interested in splitting up besides names. Some of the most common are:
-
Address information
-
Phone numbers, particularly if you need the area code to be separate
-
Emails, if you’re curious about domain information
-
Date, if you only want year or month
Units and Unit Conversion
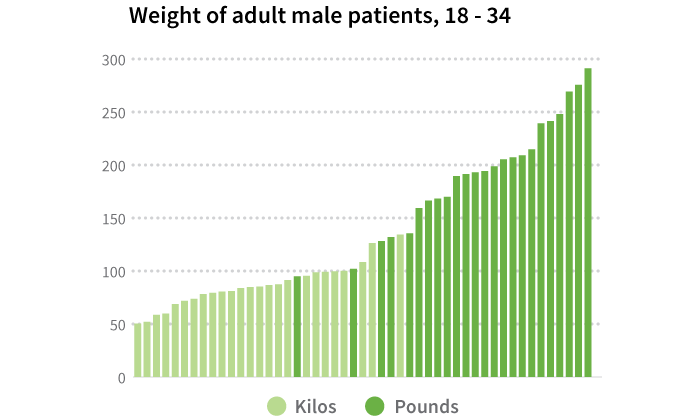
Another important data preparation task is making sure that all the data in a single field are given in the same units. Ideally, you would have specified the unit type on the input form, but you may be working with someone else’s dataset or the data may have been collected directly from other sources where the information was compiled by machines that measure in particular units. For example, you might have details from medical records from multiple countries and the patients’ weights could be in pounds for some records but in kilograms for others. It is important to convert all the numbers to either pounds or kilograms so that they are all on the same scale, otherwise the records cannot be directly compared to each other and any visualization you do of the original data would look quite strange indeed!
You should do a quick scan of the variables in your dataset to identify any fields that could potentially report multiple units so that you can figure out if these conversions are necessary. If they are, you might need to reference an additional field to identify what the original units are that you should be converting from so you know what records need to be changed. If there isn’t a specific field that lists the units themselves, other fields like geographic location can be helpful. If you cannot find a field that lets you know what the units are but you suspect that a conversion is necessary, you should contact the original provider of the data to obtain that information. It may turn out that you actually don’t need to convert anything and your data are just strange, but it’s better to check and make sure than to ignore a potential error in your data.
Another type of conversion that is sometimes less obvious is data type conversion. It is important to make sure that all of the data in a single field is being stored as the same type or your visualization might not appear correctly, depending on how your software interprets the information. For example, “80” might look like a number to you, but the computer might actually be storing it as a string of text rather than in a numeric form. Some visualization software will go ahead and treat any text that looks like a number as a number, but other software will not. It is a good idea to check that each of your fields (or variables) is stored as a single, specific data type, such as text or numeric. This will ensure that anything that is captured in that field is being treated as the data type that you mean for it to be.
Controlling for Inconsistencies
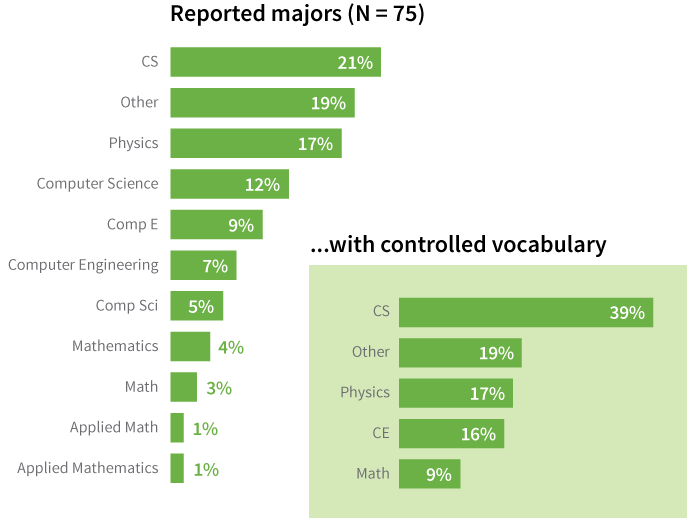
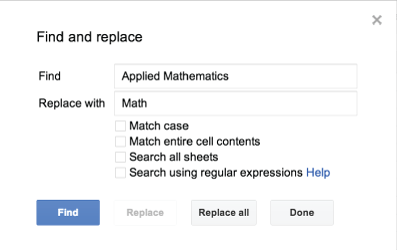
One of the most work-intensive tasks in cleaning data is handling inconsistent information. For example, we see multiple languages popping up in a single dataset more often now that the internet allows us to easily collect data from users all around the world. This can sometimes create problems when you’re trying to group things up for visualization purposes, depending on how your data entry form is designed and what data from the set you’re using. Perhaps you do a survey of college students and one of the text fields asks for their major. One student might enter “Math” while another enters “Mathematics” and another types “Applied Mathematics.” You know that all these are considered the same major on your campus, but a computer or visualization software would not group these records together. You would need to create a single controlled vocabulary term (e.g. change them all to say “Math” or “Mathematics”) or create a separate coded field if you wanted to have them treated as part of the same category.
Although the computer can aid in changing values, problems with data inconsistency often have to be handled semi-manually. If you are looking through text fields, much like when you do data coding, find and replace is your best friend. As long as you know what the main variants are of the data that you want to control, you can quickly change them all to be the same value.
Missing Values
One of the most frustrating problems is when data fields are simply blank or are incomplete. If data have not been collected, you may be able to return to the source to fill in what is missing, but you may also no longer have access to the source. It may also be possible that you do not know who the source was, for example, in the case of an anonymous survey. If you are not able to obtain the data, it is important to handle the missing values correctly. You should set pre-defined values that you can enter in where the missing values would be so when someone looks at your dataset, they know that the data for that field are actually missing and you didn’t just forget to type them in.
These values should fall well outside the range of your reasonable data so that they clearly stand for missing data and nothing else. For datasets that do not deal with negative numbers, “-9” is often used as this default value, at least in the numeric fields. “999” is another popular choice for datasets that do not use large numbers, and a single period (.) is used by some statistical software programs that may be used with datasets with both negative and large numbers. For text fields, a single dash (-) is commonly used as the indicator for a missing value.
Keep in mind that a missing value is not inherently the same thing as an intentional non-response! You don’t have the particular information that the question was asking about in either case, but when someone actively chooses not to answer, that in itself is a piece of data you wouldn’t have if the question were unintentionally skipped. Those data aren’t missing: you know exactly where they are, the respondent just doesn’t want you to have them. As discussed in the Survey Design chapter, it is good to include a “Prefer not to answer” option for questions that may be of a personal nature, such as race or ethnicity, income, political affiliation, etc. That way, you can designate a code for this type of response so when you are going through your dataset later on, you know the difference between the respondents that purposely chose not to provide you a given piece of information and the data that are just missing altogether.
It is important to note that for purposes of basic descriptive visualization, missing values are described by including a non-responder category or by noting a change in the sample size. However, in inferential statistics, missing values may be dealt with in a variety of other ways, from exclusion to imputation to full analysis methods like use of EM algorithms.
Minimizing the Burden of Data Preparation
The best solutions are preventive. If you are the one creating the form for user input, do whatever you can to prevent receiving data that will require intensive handling during the data preparation stages. In the Types of Data Checks chapter, we’ll talk about different strategies for minimizing the number of data preparation tasks that need to be performed.
If you’re not the one collecting the data but can speak with the people who are, try to work with them to identify and resolve any problematic data collection points using the strategies in the Types of Data Checking chapter as a guide.
Post-Data Preparation
Once your data are separated into the fields you want, converted into the units and types you intend to work with, and terminology is controlled, you’re ready to proceed to the data cleaning phase where you’ll check for actual errors in the data. In the next three chapters, we’ll talk about the basic process of data cleaning, different processes for performing checks on your data to find problems, and what you can and can’t do with data cleaning.